What Does Recharge Look Like?
May 2023 Hydro Report
April brought rain! After so many months of focusing on how dry things are, it’s refreshing to take a look at what happens when rainfall makes its way into the groundwater system. With spring in full swing and small rainfall events, plants and trees seem to be celebrating and masking drought conditions.
First, the good news:
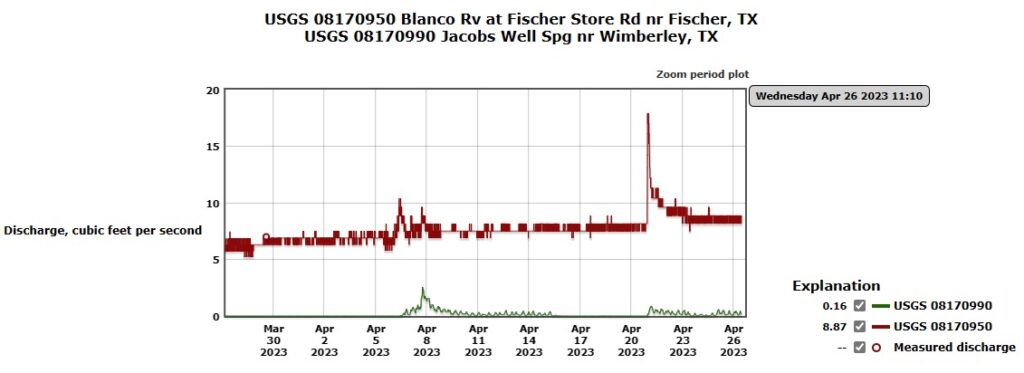
In April, there were 4.3 inches of rain recorded at the EAA Weather Station in Burnett Ranches and 4.96 inches recorded at a private weather station in Woodcreek. The above-average rainfall allowed some runoff, and Jacob’s Well, Cypress Creek, the Middle Trinity Blanco springs, and the Blanco River had a short-duration increase in flow. In the graph below, Jacob’s Well (headwaters to Cypress Creek) is shown in green and the Middle Trinity Blanco River springs (which provide baseflow during drought to the Blanco River in western Hays County) are shown in red. Flow increased at both Jacob’s Well and the Blanco River during the April 8 and April 21 rainfall events.
Now, a nerdy, science look at recharge (more good news):
Hydrogeologists look at changes in groundwater conductivity as one way to track how quickly an aquifer receives recharge.
Conductivity is a measure of how quickly an electrical current can pass through a medium. The more particles there are, the faster the current can go. Think about copper wire vs Styrofoam. Copper wire is great at conducting electricity because it’s so dense. Styrofoam isn’t a good conductor because the particles are far apart.
Conductivity is exactly the same for water; typically it is measured in micro siemens per centimeter (umS/cm). As groundwater sits in an aquifer, the water interacts with the rock layers surrounding and dissolves away part of the rock. As a groundwater user, you may notice white spots on dishes or deposits on faucets and fixtures–that is likely calcium from the limestone (calcium carbonate) aquifer. Traditionally, groundwater has more dissolved particles the older it is (or if it is stored in an easily eroded rock layer). Surface water typically has fewer dissolved particles, because it not in contact with rock for nearly as long as groundwater. And rainwater has the lowest dissolved particle load, because it is evaporated and stored in the atmosphere until it condenses and falls to the ground—never in contact with rock.
In our karst landscape with its rapid recharge, we can measure the effect of stormwater recharge coming through the Middle Trinity Aquifer to Jacob’s Well spring by tracking conductivity over time. A drop in conductivity shows that rainwater (low particle load, and therefore, low conductivity) is making it thought the system very quickly. This is evident during recharge from the 2+ inch rain in early April, however the later event in April did not produce a similar response:
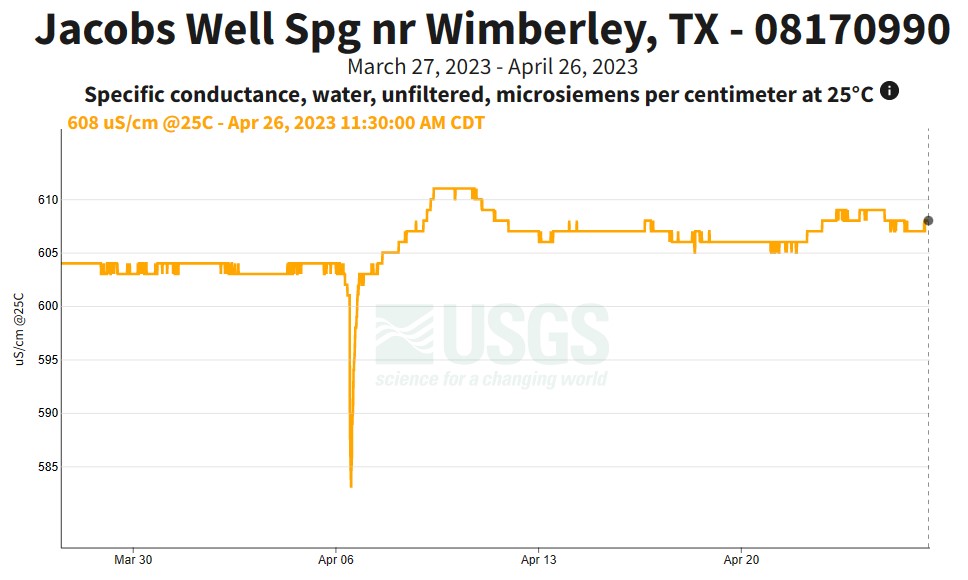
Recharge is much needed right now, however, from looking at the conductivity data, we can see that the rainfall didn’t generate the substantial, prolonged recharge that we need to replenish area water supplies and sustain healthy spring flow.
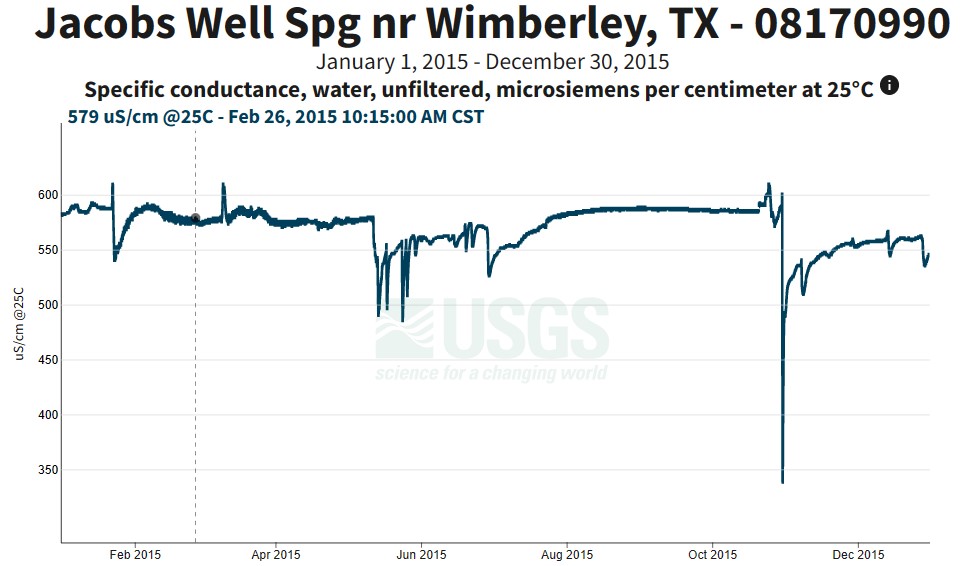
In contrast, 2015 was a historic year for rainfall that most Wimberley Valley residents remember too well. Two major rainfall events caused tragic flooding–one along the Blanco River and a second along Cypress Creek. From a recharge standpoint to see what it will take to end the current drought, it is instructive to examine the Jacob’s Well spring flow and conductivity record from a wet year most are familiar with. Jacob’s Well spring started 2015 with flow below 1 cubic foot per second (cfs) but ended the year with nearly 30 cfs. The conductivity data record shows a sustained recharge pattern. The sharp drops in conductivity mark significant rainfall events; the slow rise of conductivity shows sustained recharge from runoff and creek flow in recharge areas.
While the aquifers need sustained recharge, it would be preferable to get well-timed rainfall that would allow for runoff without massive flooding. Given last year’s 16+ inch rainfall deficit, the area needs a series of 4-6 inch rains that saturate soils, allow runoff, and generates prolonged flow in recharge area creeks.
Finally, the not great news: Drought is still here.
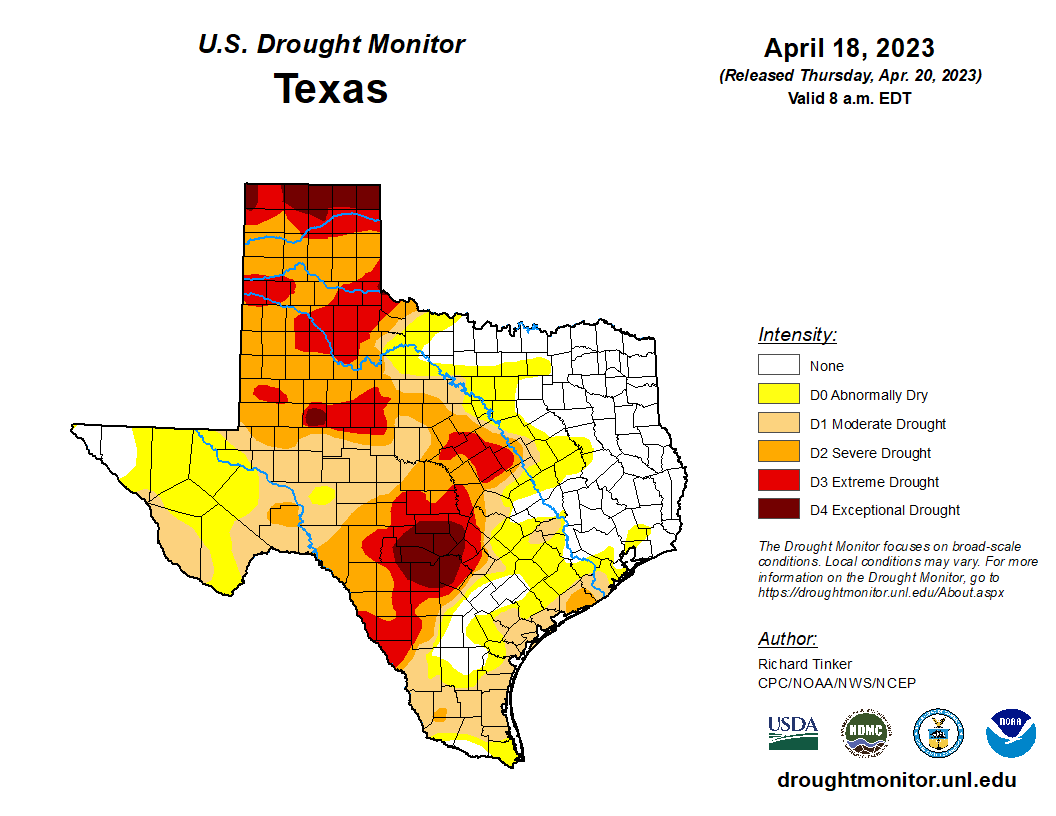
Much of Hays County and its contributing watersheds are in Extreme or Exceptional Drought according to the US Drought Monitor. While Jacob’s Well and the Blanco River Middle Trinity springs responded to recent rainfall, they remain at record lows.
The NOAA Climate Prediction Center’s 6-10 day outlook for precipitation shows a higher than average percent chance of rainfall for our area (link). However, the Seasonal Precipitation Outlook shows that wetter than normal conditions won’t occur until Dec-Jan-Feb of 2023-24 (link).
Importance of Conservation
Area groundwater districts remain in severe drought stages to extend water supplies and protect spring flows. Please continue to conserve. Coordinated water conservation is key to preserve groundwater availability, spring flow, and water supplies. All of the Hill Country is experiencing rainfall deficits which leading to pronounced drought conditions in our area.
Most communities in the Hill Country are groundwater-dependent, so drought conditions are particularly troublesome for water supplies, recreation-based tourism, and springs and rivers. Please follow groundwater district drought restrictions and local water provider drought water use guidance. Limit outdoor irrigation and conserve water indoors. Identify and fix leaks. Conserve water to prolong water supplies until rainfall can replenish our aquifers. While we can’t control the weather, we can conserve water and look for innovative ways to use alternate supplies (like site-harvested supplies—rainwater and AC condensate) to lessen impacts of pumping. While each aquifer behaves differently, all groundwater is limited and deserves to be used wisely. For more information on native landscapes, rainwater harvesting, leak identification tips and more, visit the Home Owner Resource page.
No matter what area agencies call their drought declaration, coordinated water conservation is important to preserve groundwater availability, spring flow, and water supplies.
| Agency | Drought Stage | Date Declared | Details |
| Barton Springs Edwards Aquifer CD | Stage III Critical Drought (minimum of 30% Reduction, 100% Reduction for conditional permits) | Oct 2022 | Press Release, 10/20/2022 |
| Blanco Pedernales GCD | Stage 3 – 20-50% Reduction in pumping | August 2022 | Press Release, August 2022 |
| Comal Trinity GCD | |||
| Cow Creek GCD | Stage 3 – 30% Reduction in pumping | June 2022 | Public Notice, 6/14/2022 |
| Hays Trinity GCD | 30% Reduction from Historic Use for Jacob’s Well GMZ, 40% from Permitted Volume for remainder of the District | July 2022 | Board Order, 7/31/22 |
| Edwards Aquifer Authority | San Antonio Pool is in Stage 3 – 35% Reduction | June 2022 | Press Release, 6/13/22 |
[Updated 4/26/2023]
Annual rainfall average for Central Texas is approximately 33 inches per year. To understand recharge potential, it’s important to track where rain falls, how fast it falls, and how saturated the soils are. Key rain gages for the area are (upstream to downstream):
-
- USGS 08170800 Blanco Rv at Crabapple Rd nr Blanco, TX
- USGS 08170890 Little Blanco Rv at FM 32 nr Fischer, TX
- EAA Burnett Ranches (HAY01WS) Weather Station & Soil Moisture Site
- The Watershed Association’s Weather Station at Jacob’s Well
- USGS 08170950 Blanco Rv at Fischer Store Rd nr Fischer, TX
- EAA Rebecca Springs (COM03WS) Weather Station & Soil Moisture
Realtime comparison of two key spring flow sites: (USGS gages: Blanco at Fischer Store–08170950 and Jacob’s Well–08170990)
Jacob’s Well Spring, Cypress Creek
Jacob’s Well is a Middle Trinity Aquifer spring that provides the baseflow for Cypress Creek.
-
- Realtime data: USGS 08170990 Jacobs Well Spg nr Wimberley, TX
- Spring flow is a strong indicator of groundwater levels in the Jacob’s Well Groundwater Management Zone (JW GMZ), because low spring flow directly correlates to low well water levels.
- The 10-day average spring flow is a drought trigger for the HTGCD Jacob’s Well GMZ (Thresholds: 10% Curtailment: below 6 cfs; 20% Curtailment: below 5 cfs; 30% Curtailment: below 3 cfs).
- Groundwater pumping causes 1 to 1.5 cfs fluctuation in flow and is more evident under low flow conditions.
Pleasant Valley and Park Spring, Blanco River
Pleasant Valley and Park Springs are Middle Trinity Aquifer springs that provide significant baseflow for the Blanco River, especially during dry periods.
-
- Realtime data: USGS 08170950 Blanco Rv at Fischer Store Rd nr Fischer, TX
- Springflow can be estimated by using the USGS gage at Fischer Store Rd (linked above) and subtracting any upstream flow indicated by the USGS 08170905 Blanco Rv at Valley View Rd nr Fischer, TX.
- These springs are central to the HTGCD Regional Recharge Study Area, because springflow is indicative of water storage in the local groundwater system.
The Hill Country’s iconic streams are known for their clear water and rocky bottoms. Oftentimes, cracks, caves, and faults are visible in stream beds. When creeks and rivers are flowing, these cracks, caves, and faults channel water from the surface into the groundwater system below. Streamflow gages are strategically located to help monitor gaining (where springs are found) and losing (where recharge happens) sections of creeks and rivers. Key gages include:
-
- Realtime data: USGS 08170950 Blanco Rv at Fischer Store Rd nr Fischer, TX
- Springflow can be estimated by using the USGS gage at Fischer Store Rd (linked above) and subtracting any upstream flow indicated by the USGS 08170905 Blanco Rv at Valley View Rd nr Fischer, TX.
- Realtime data comparison of three key USGS gages (Blanco at Fischer Store–08170950, Jacob’s Well–08170990, Blanco at Wimberley–08171000)

Groundwater monitoring is an art. TWDB, HTGCD, and BSEACD have extensive monitoring networks.
Key wells from west to east:
-
- HTGCD Burnett Ranch well (aka ESD well) – Middle Trinity aquifer
- HTGCD Mt Baldy well – Middle Trinity aquifer
- HTGCD Downing well – Middle Trinity aquifer
- BSEACD Hoskins well – Edwards aquifer
- BSEACD Lovelady well – Edwards aquifer

-
- USGS Texas Water Dashboard
- LCRA Hydromet
- TWDB Recorder Wells
- EAA Rainfall Monitoring Network
- BSEACD Monitoring Sites
- ATX Floods Map — Travis, Hays, Burnet, Caldwell, Bastrop, and Williamson County road status map
- Hays County Road Status map
- TCEQ Nonpoint Source Pollution Project Viewer
- TCEQ Source Water Quality Monitoring (SWQM) Data Viewer
- Texas Stream Team/Cypress Creek Project
Archived Hydro Reports
| Month | Cypress Creek – Jacob’s Well | Blanco River – Pleasant Valley & Park Springs | Date Published | |
| 2023 Jan | 2022 In Review: Rainfall, Spring Flow, Streamflow, and Groundwater Levels | 1/29/23 | ||
| 2022 Oct | Recent Rains Lead to Some Flow at Jacob’s Well | 10/28/22 | ||
| 2022 Sept | What does Drought Recovery Look Like? | 9/13/22 | ||
| 2022 June | Wide-spread Drought | 6/16/2022 | ||
| 2022 April | Drought Conditions Return | 4/4/2022 | ||
| 2022 Feb | Three-month Dry Spell Ends with Icy Precipitation | 5.7 cfs | 16.4 cfs | 2/3/2022 |
| 2021 Nov | Rain brings increases in spring flow and groundwater levels | 19.2 cfs | 22.5 cfs | 11/14/21 |
| 2021 Oct | Rain brings temporary increases in spring flow and groundwater levels | 2.7 cfs | 16.0 cfs | 10/7/21 |
| 2021 Sept | Water levels and spring flow on the decline (again) | 2.6 cfs | 28.1 cfs | 9/16/2021 |
| 2021 July | Spring flow increased, Groundwater levels still low | 3.9 cfs | 33.2 cfs | 7/6/2021 |
| 2021 May | Recharge! | 2.2 cfs | 13.5 cfs | 5/18/2021 |
| 2021 April | Lowest Groundwater Level Recorded Since 2005 | 1.4 cfs | 11.4 cfs | 4/22/2021 |
| 2021 March | 2.4 cfs | 13.5 cfs | 3/10/2021 | |
| 2021 January | 0.3 cfs | 11.8 cfs | 1/19/2021 | |
| 2020 December | 1.3 cfs | 16.8 cfs | 12/8/2020 | |
| 2020 November | 1.1 cfs | 17.1 cfs | 11/11/2020 | |
| 2020 October | 1.7 cfs | 17.7 cfs | 10/25/2020 | |
| 2020 September | 6.5 cfs | 25.2 cfs | 9/14/2020 | |
Please note: Page under construction. Please email robingary@wimberleywatershed.org with suggestions or questions.